API architecture diagrams: From L0 to Ln (complete guide)
On this page
An API architecture diagram shows the clients, gateways, services and data stores involved in an API, and the relationships between them. Use a component view to explain structure, a sequence view to explain a request, and a deployment view to show where the system runs.
This guide uses the same API gateway example at several levels of detail. Start with the view your audience needs, then follow the worked example to separate live traffic, policy distribution and supporting services.
What is an API architecture diagram?
An API architecture diagram is a visual representation of an API's components, such as gateways, backend services, and identity providers. It shows how those pieces are structured and how they interact with each other and with client applications, using structure and relationships rather than implementation code. The level of detail it shows depends on what the audience needs to decide or build.
Types of API architecture diagrams
Not every API architecture diagram needs to carry the same information. Depending on what the reader is trying to understand, a handful of diagram types cover most of what teams actually document. Picking the wrong type is often why a diagram feels unhelpful, even when it's technically accurate.
| Question to answer | Start with | Include |
|---|---|---|
| What connects to what? | Component view | Clients, gateways, services, owners and boundaries |
| What happens during one request? | Sequence view | Calls, responses, checks and failure paths |
| Where does it run? | Deployment view | Runtime instances, networks, regions and connectivity |
| Where does sensitive data go? | Data-flow view | Sources, transformations, stores and access boundaries |
Use separate views when the questions differ. Keeping each diagram focused makes it easier to review and keep current.
Sequence diagrams
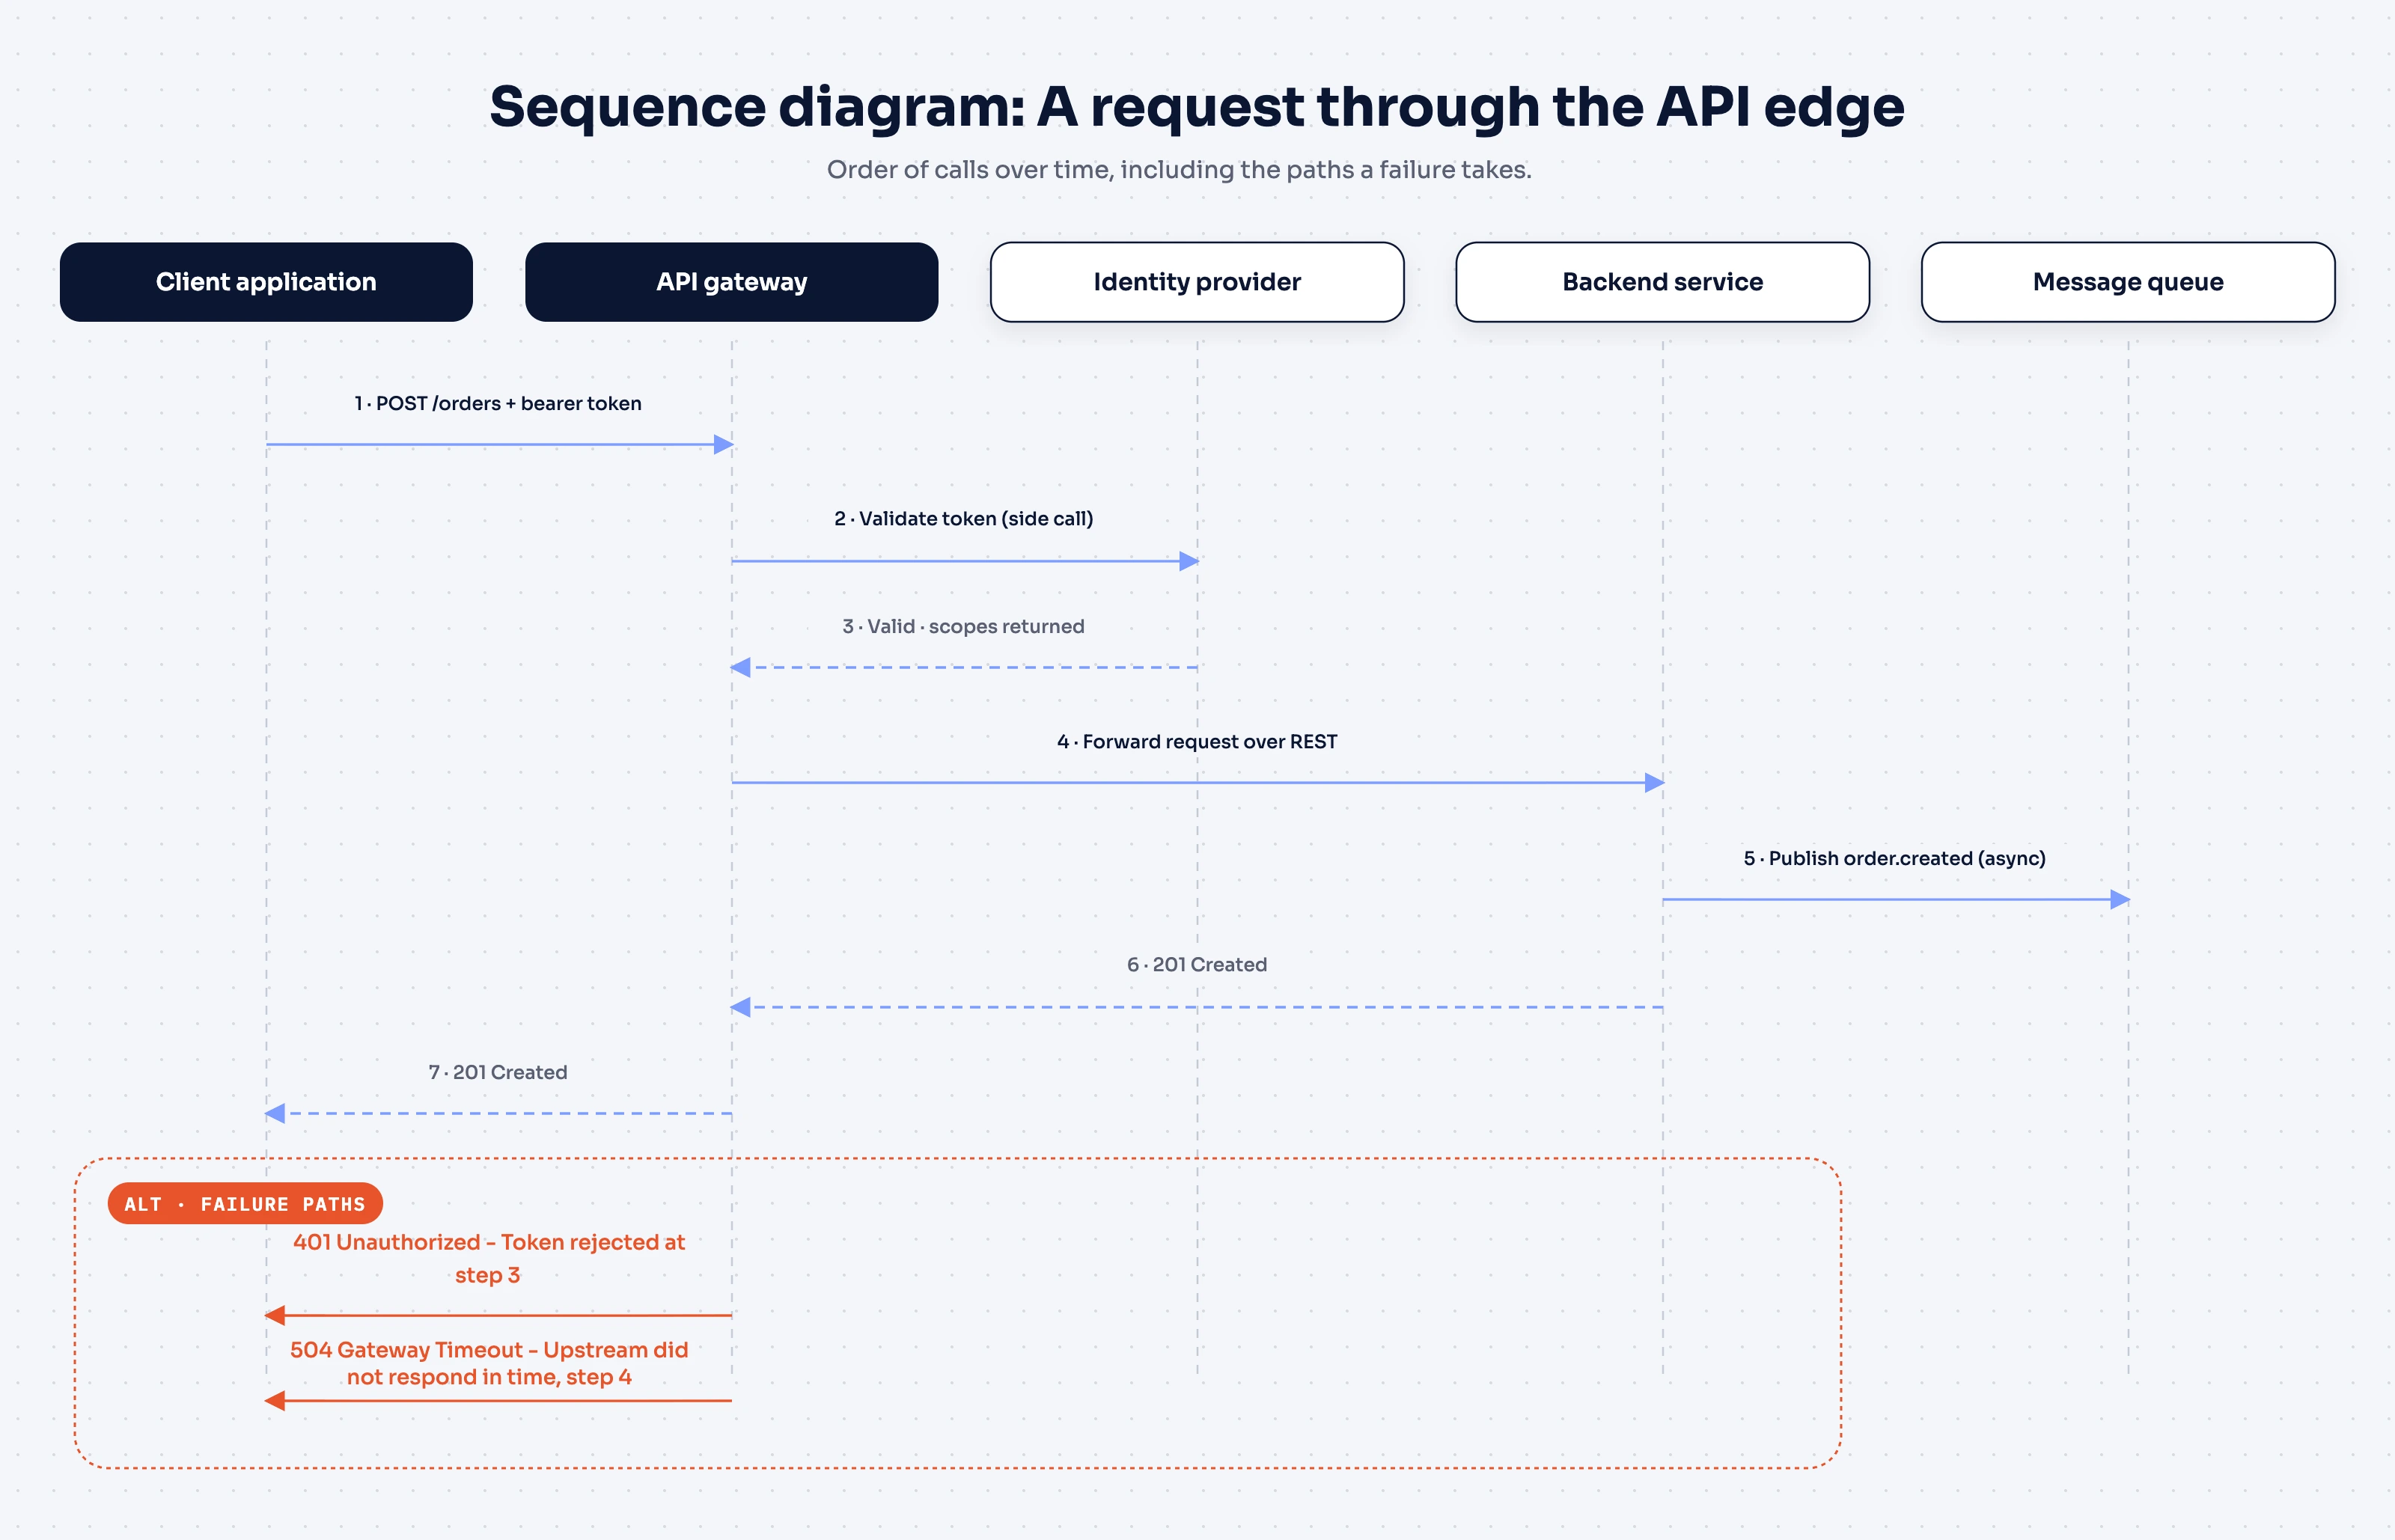
A sequence diagram shows the order of calls between components over time. A client sends a request, the gateway validates a token, the request reaches a backend service, and a response comes back along REST or asynchronous paths. Sequence diagrams are the right tool when the question is "what happens, and in what order?" rather than "what exists?"
They're particularly useful for documenting error-handling paths. A reviewer can trace exactly where a timeout or a rejected token short-circuits the flow, which makes sequence diagrams a natural companion to API documentation for anyone debugging a failed integration.
Component and service diagrams
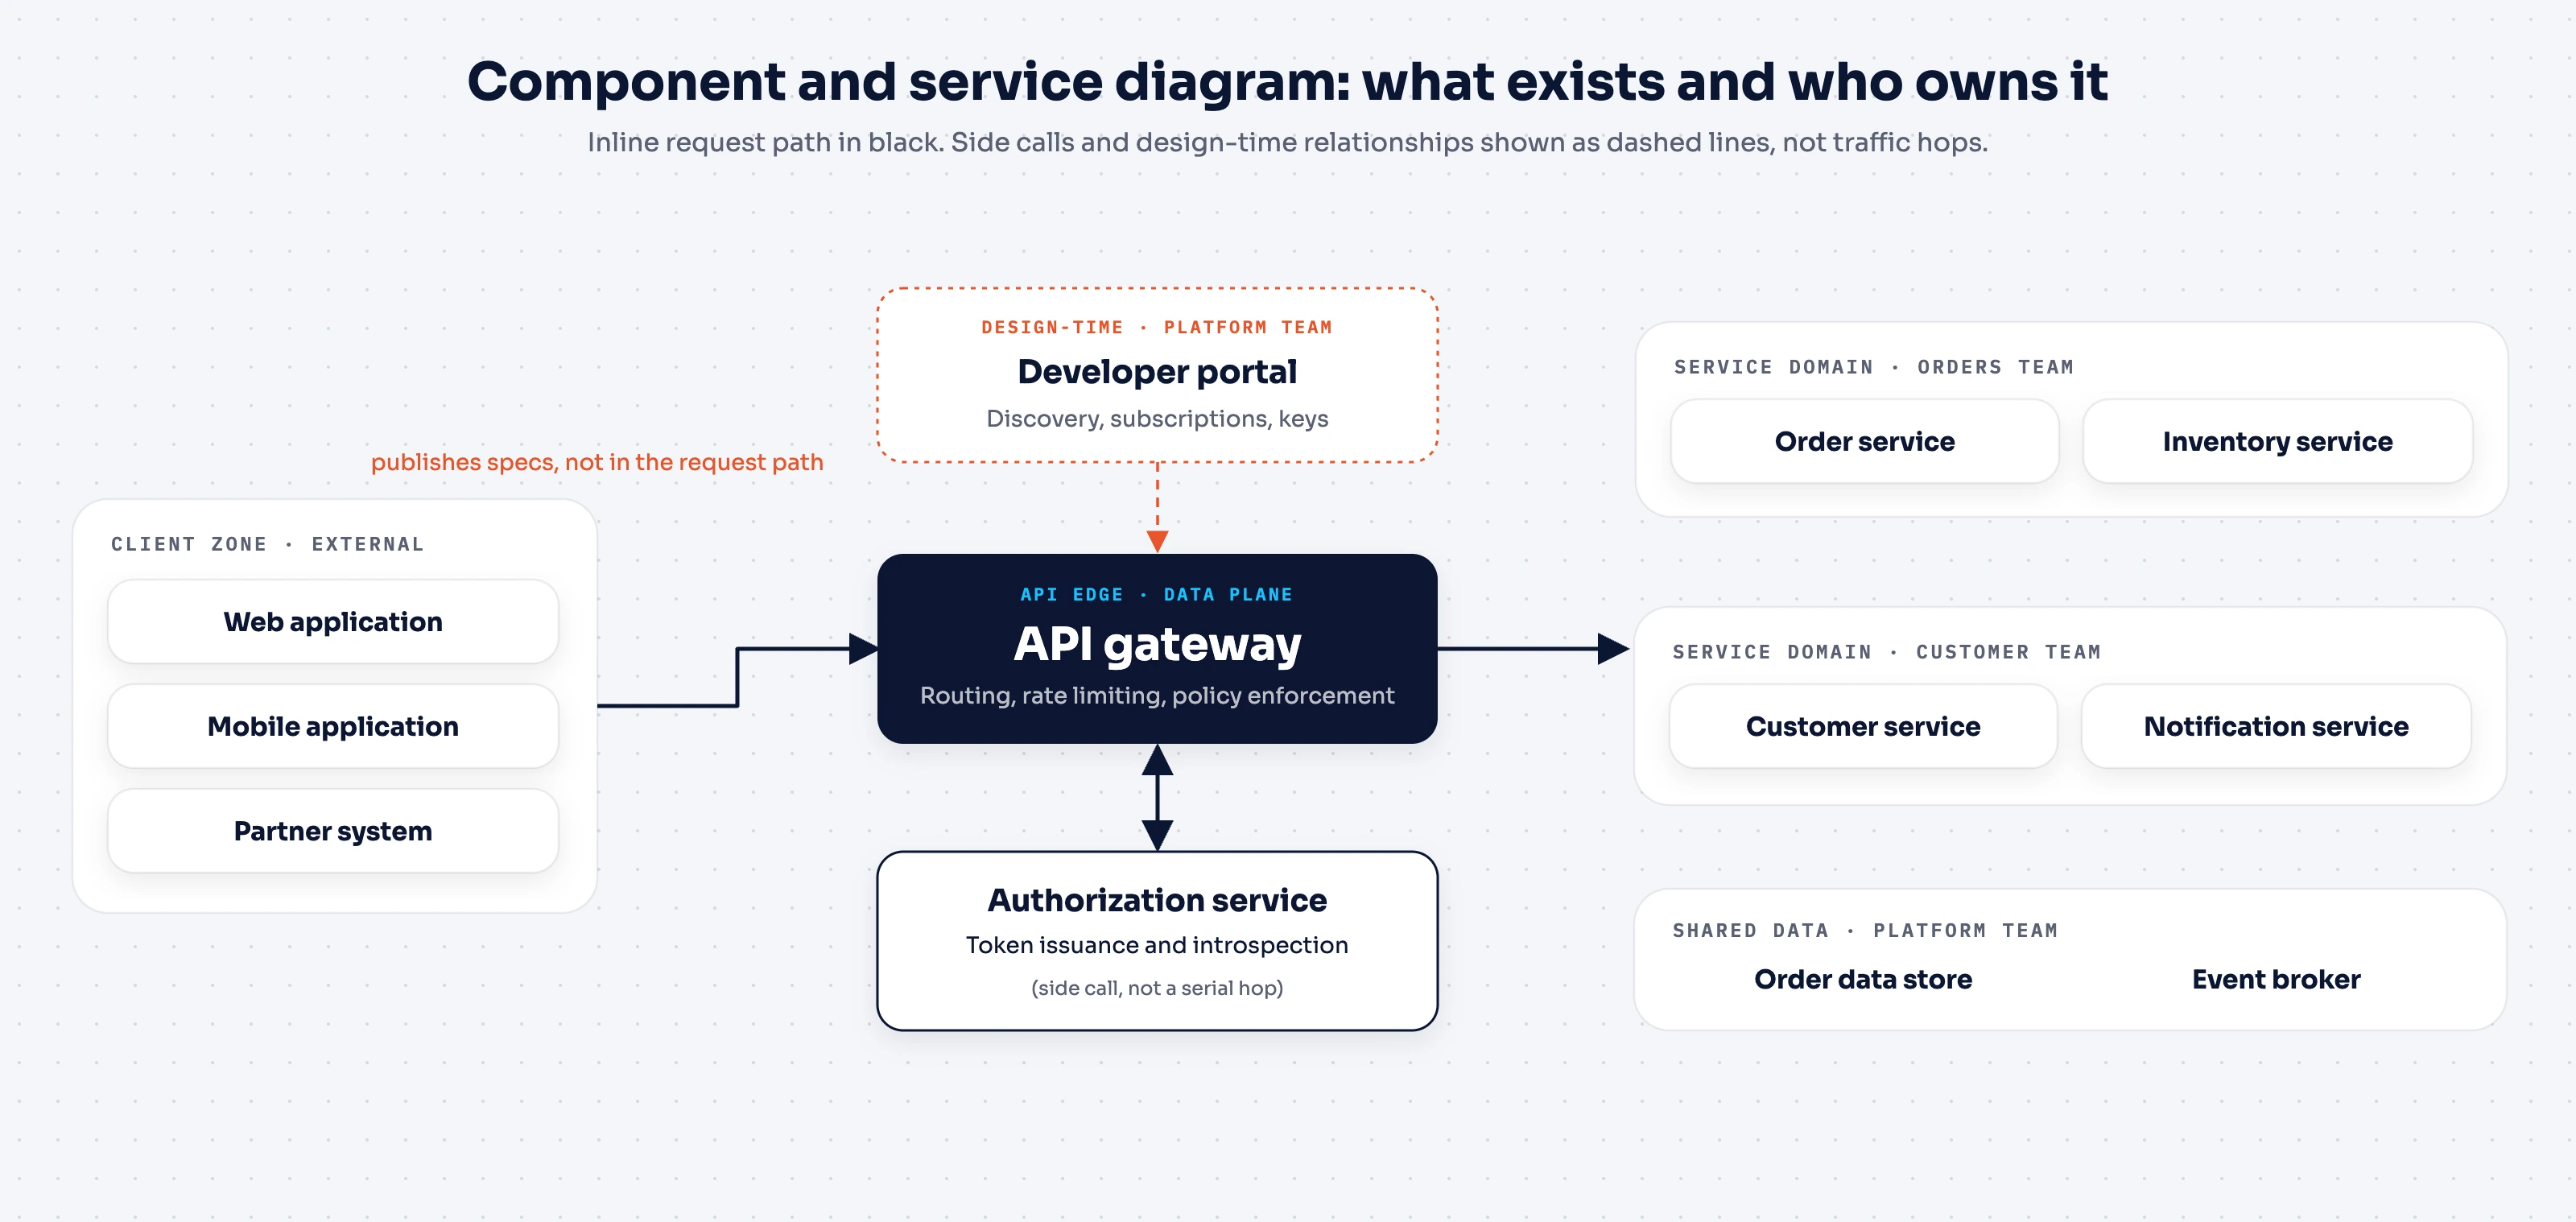
A component diagram shows the API components in a system, such as a gateway, an authorization service, and a set of backend services, along with the boundaries between them. This is the diagram type most people picture when they hear "API architecture diagram."
In a microservices architecture, where dozens of small services each own a narrow piece of business logic, a component diagram is often the only artifact that shows the whole picture in one view. It answers "what exists, and who owns it?" That makes it useful for onboarding, and for drawing service ownership lines before an incident rather than during one.
Deployment diagrams
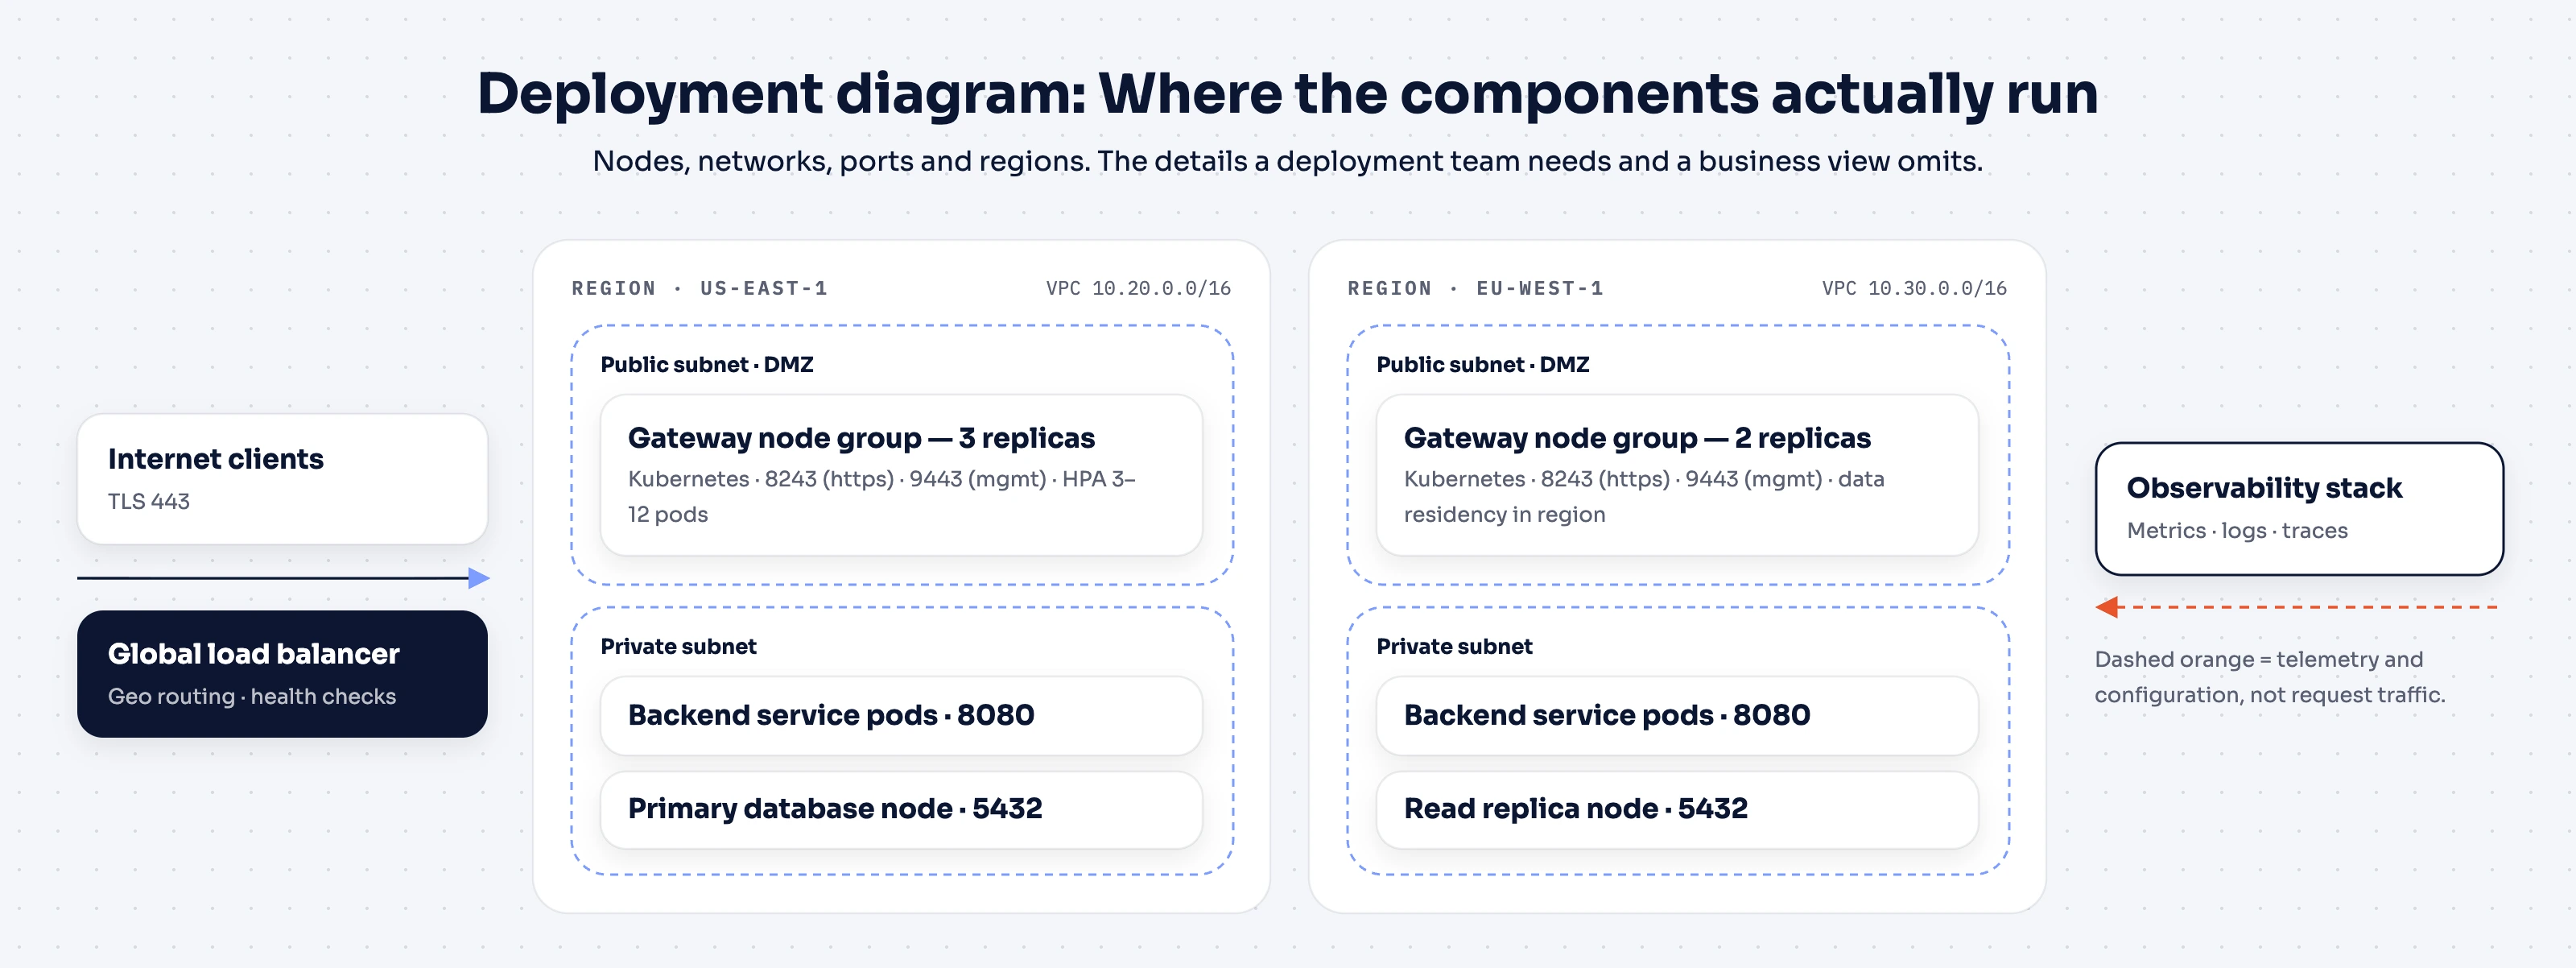
A deployment diagram shows where components actually run: which node, which API server, which network, which region, and how traffic reaches them. This is the level of detail a deployment team needs, and it's the level most business-facing diagrams deliberately leave out. Ports and node counts don't help an executive decide whether to fund a project.
Data flow and integration diagrams
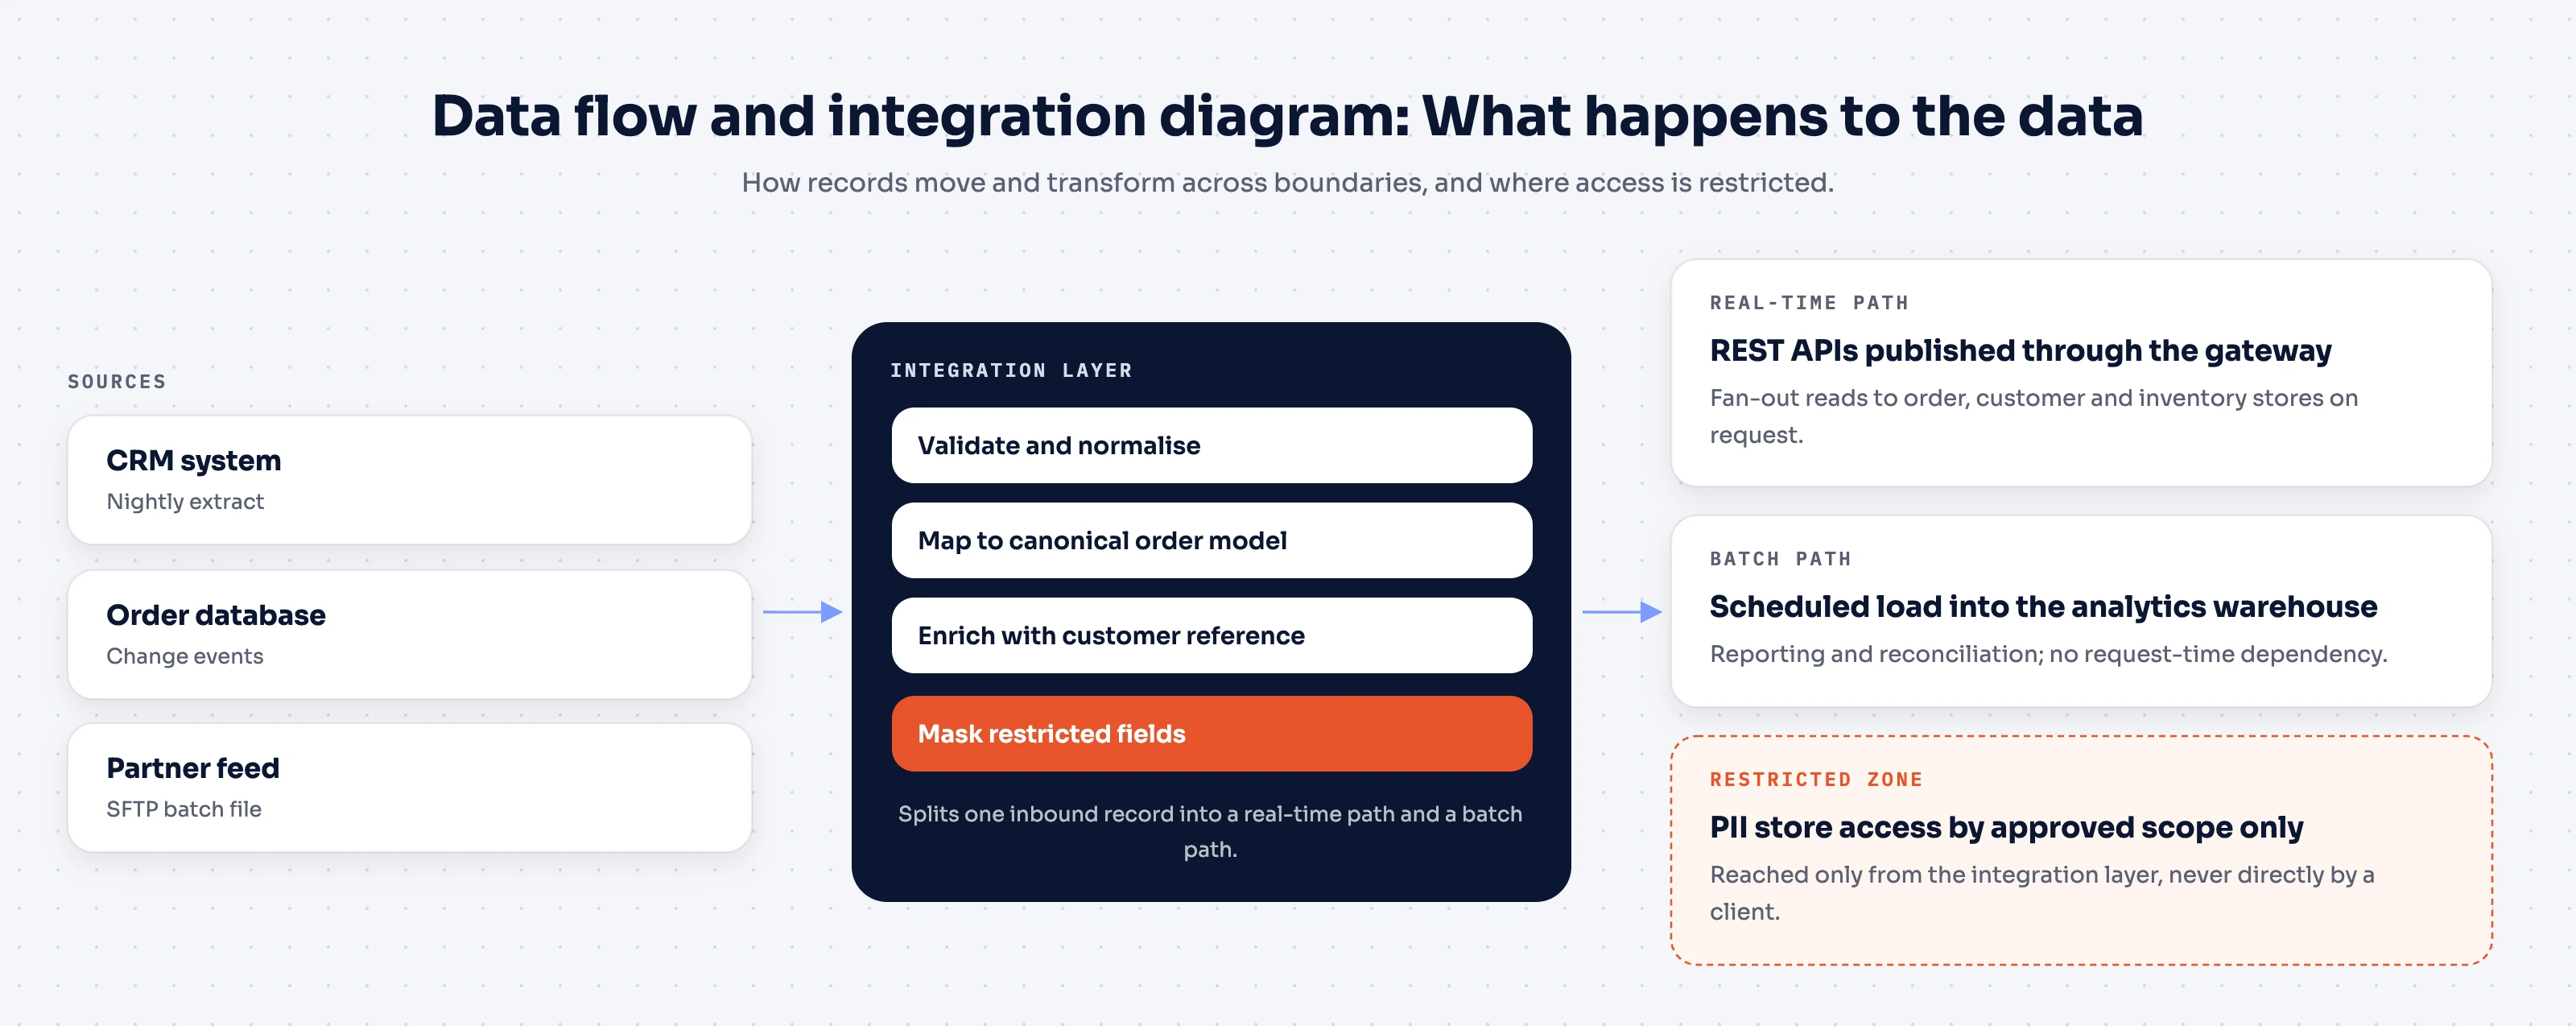
A data flow diagram traces how data moves and transforms as it crosses system boundaries. It shows what an integration layer reshapes, where a batch job picks up records versus where a real-time path pushes them, and where data access is restricted.
These are the diagrams to reach for when the question isn't which services exist, but what happens to the data as it passes through them. They tend to matter most in systems built around REST APIs that fan out to several downstream data stores.
The L0-to-Ln methodology
Diagram types tell you what to draw. The harder problem is deciding how much of it to draw for a given reader, and that's the problem the L0-to-Ln API architecture methodology addresses directly.
In this guide, L0-to-Ln is a convention for progressively adding detail. Teams can use different numbering schemes, so define the meaning of each level in the diagram set. Do not assume these labels correspond directly to the C4 model, whose core views are system context, container, component and code.
Know your audience first
Different stakeholders need different things from the same underlying API architecture:
- Business leaders and executives want the why: return on investment, time saved, and the effect on user experience.
- Architects and product owners want the what and how: major components, integration patterns, and the API design decisions behind them.
- Deployment teams (DevOps, SRE, infrastructure) want the where: networking requirements, ports, and runtime configuration.
- Implementation teams (developers and engineers) want the details needed to build: data types, communication protocols, and API components at the code level.
A single diagram tuned for one of these groups will either bury the others in detail they don't need or leave out the detail they came for.
How the levels work
L0-to-Ln starts at Level 0, the most abstract view, and adds detail one level at a time until it reaches Ln, the level of detail a specific decision or audience requires. Applied to a solution architecture, it typically looks like this:
- L0: One abstract view of the solution and its major interactions. No product names, no protocols.
- L1: Concrete technologies enter the picture (a gateway, an identity provider, an integration layer), along with the high-level flow between them.
- L2: Communication patterns (REST, async messaging), service structure, and data paths.
- L3 to Ln: Deep dives into individual components, down to whatever level a decision requires.
The same progression applies independently within business architecture and deployment architecture views. It's a way of stopping at the level the current conversation actually needs, rather than defaulting to either an oversimplified box or an overloaded one.
Why L0 to Ln works
- Simplicity where it counts. Each level shows only what its audience needs right now, deferring everything else to a deeper level rather than a footnote.
- Guided elaboration. Detail gets added within the same vertical, one decision at a time, instead of producing one diagram that tries to answer every question at once.
- Clean cross-references. Because business, solution, and deployment views progress independently, a reader can move between an L0 business view and an L1 solution view without the diagrams contradicting each other.
- Reusable documentation. Because the levels are modular, they double as onboarding material, audit artifacts, and review references without a rewrite each time.
Worked example: Diagramming an API gateway deployment
Applying L0-to-Ln to an actual API gateway deployment shows what changes at each level. Each level earns its place by answering a specific audience's question, not by adding detail for its own sake.
The example draws on how API platforms typically separate a control plane from the gateways it governs. That split is common enough across the industry to serve as a realistic stand-in for most API-led architectures, not just one vendor's implementation.
Editable API request-flow template

Solid arrows show the request and data path. Dotted arrows show configuration or supporting interactions. The identity-provider call is optional: a deployment that verifies a signed token locally may not need introspection for each request. Adapt the labels and boundaries to your system before using the diagram in a review.
Download editable Mermaid source
L0: Executive and business view
At L0, the diagram shows client applications reaching an API layer that sits in front of backend systems, full stop. No gateway product, no protocol names.
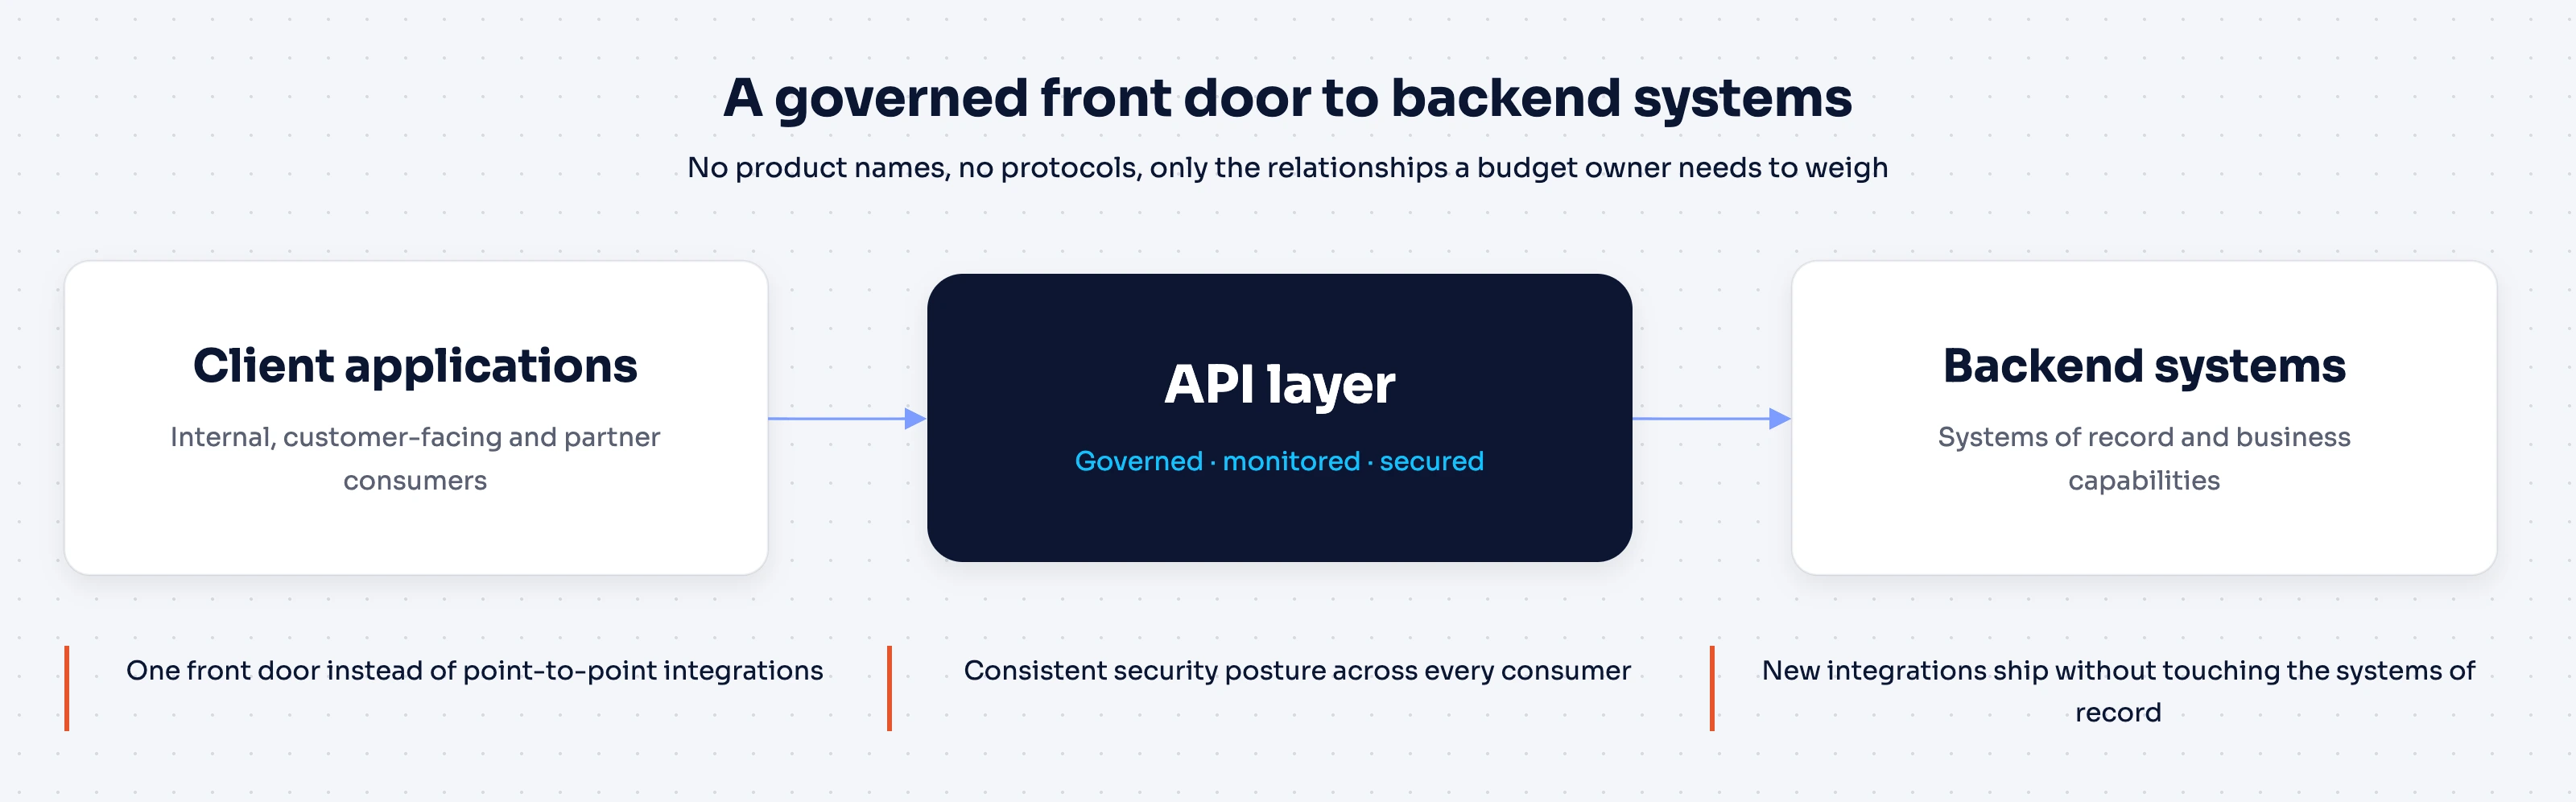
This is the view worth showing a budget owner. APIs give the organization a governed, monitored front door to its backend systems, which matters for security posture and for how quickly new integrations can ship. It doesn't need a gateway vendor's name to make that case, and adding one at this level would just be noise.
L1–L2: Solution and integration view
At L1–L2, the abstract "API layer" splits into its real components. In a typical API platform architecture, an API control plane handles design, policy, and lifecycle management, while a separate gateway, the data plane, actually processes traffic. Once configured, the gateway runtime serves API traffic according to the policies defined in the control plane. That's the gateway's job at runtime; the control plane's role is configuration, deployment, monitoring, and governance.
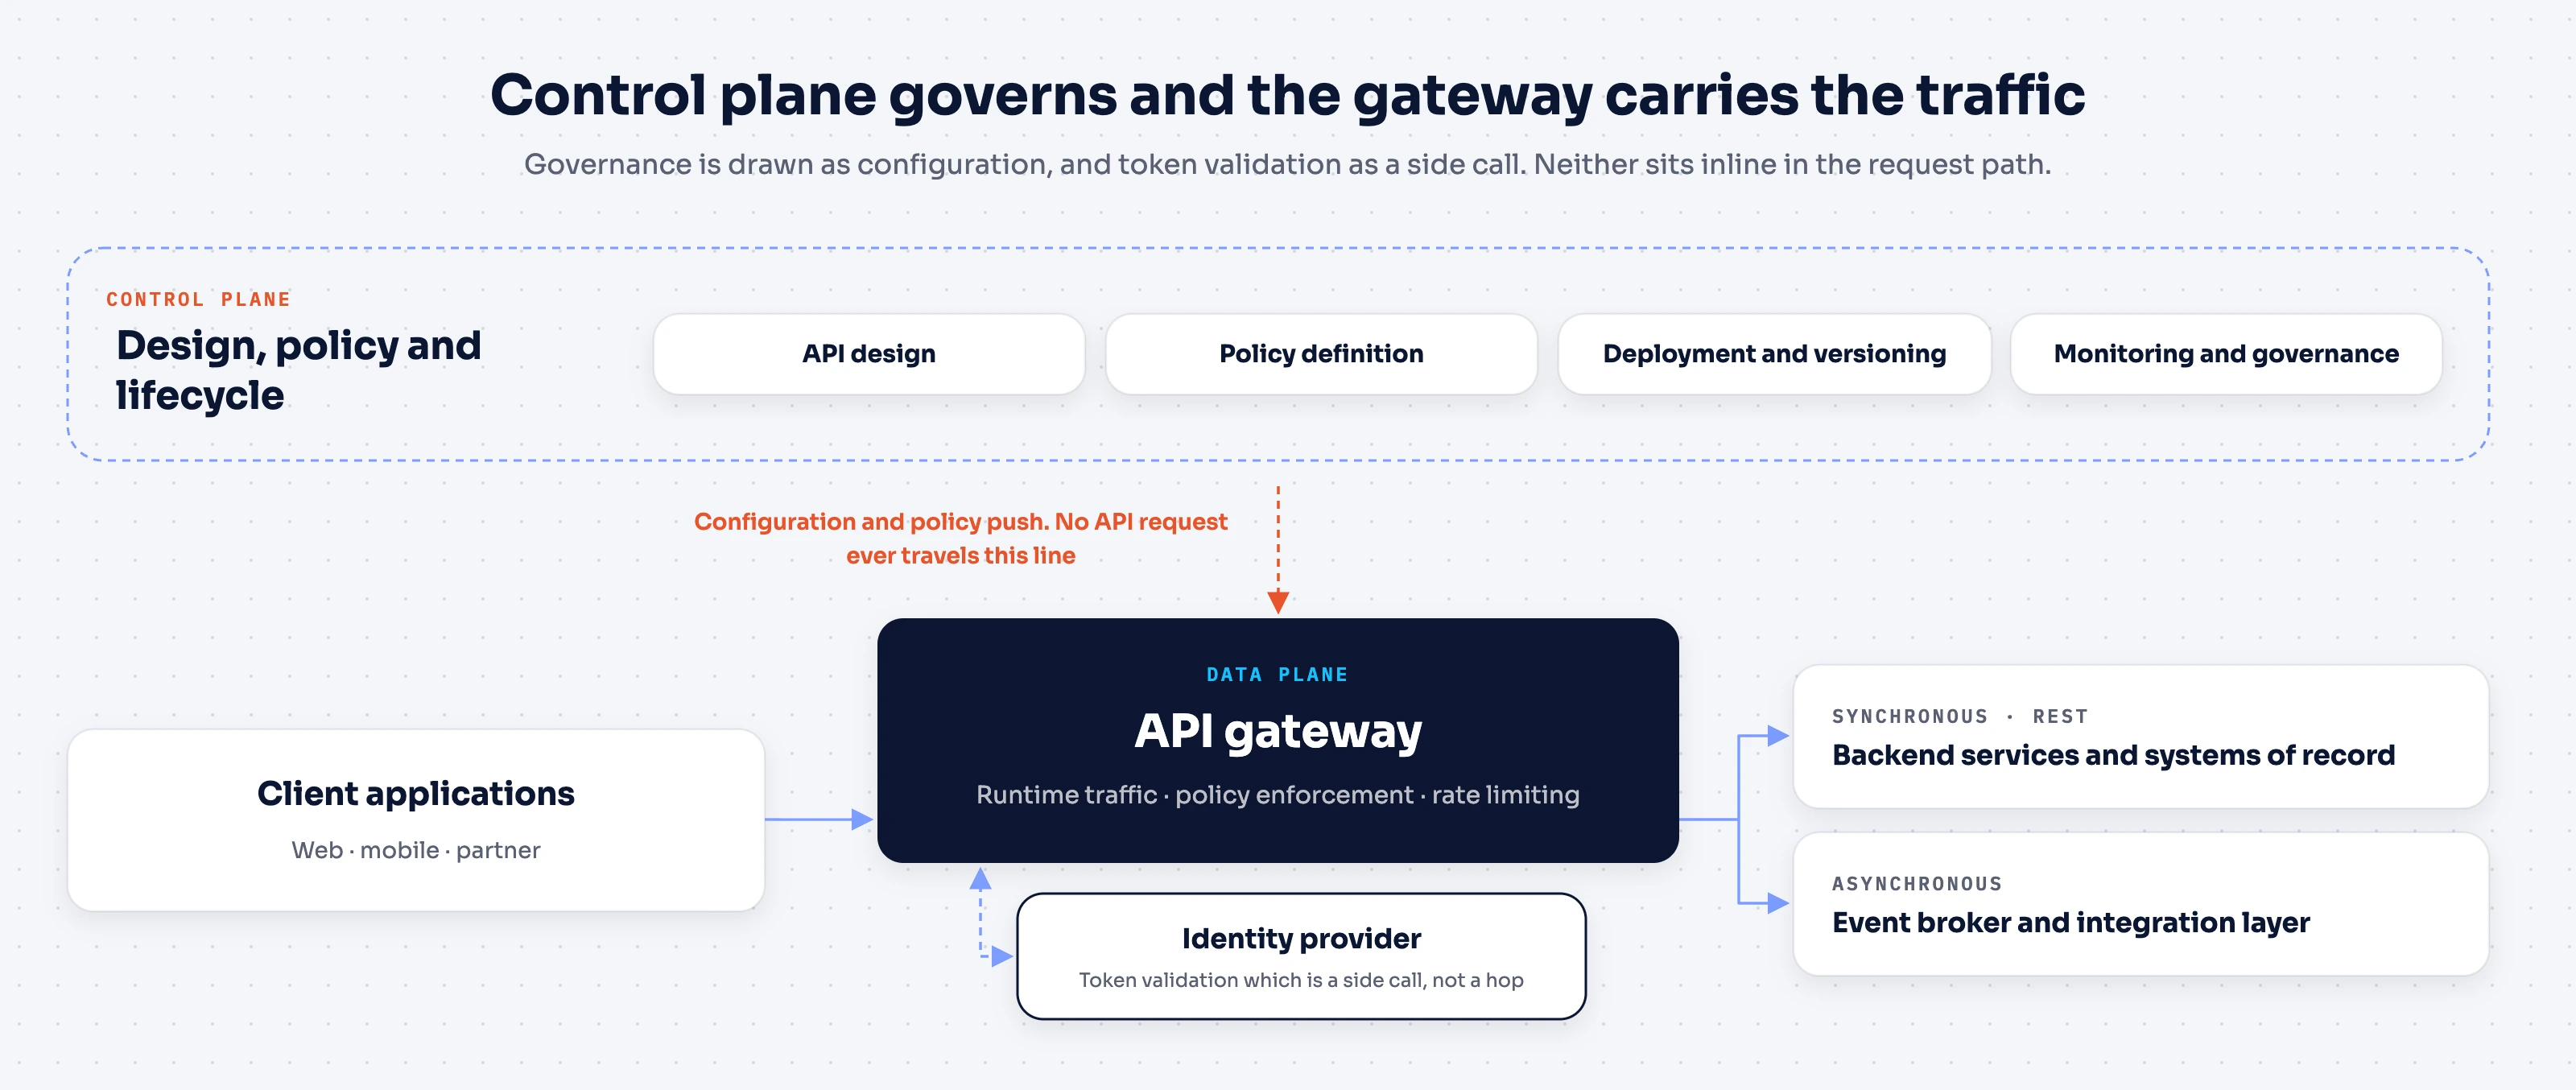
Two details here are easy to get wrong in a diagram:
- The control plane's relationship to the gateway is a configuration and policy relationship. Draw it as governance, not as a hop the traffic passes through.
- Identity provider calls for token validation are a side call the gateway makes, not a mandatory sequential step wired into every downstream service.
Drawing either one inline in the request path is a common mistake that makes the traffic path look more sequential, and more fragile, than it really is.
This example models one common approach: an external introspection call. A gateway that trusts locally verifiable tokens, such as signed JWTs checked against a cached key set, can skip that network call entirely. The side call shown here is one design choice, not the only correct architecture.
Ln: Deployment detail
At Ln, the question becomes where the gateway itself runs, and Choreo API Management gateway types illustrate why this level resists a one-size-fits-all answer. Two separate questions are worth keeping apart here: who operates the runtime, and whose gateway software it is.
- A cloud-managed gateway has its runtime operated by the provider, which suits teams that want to move quickly without owning gateway infrastructure.
- A self-hosted or hybrid gateway runs the same provider's software inside the customer's own environment, which fits organizations with data residency requirements or existing infrastructure they don't want to abandon.
- A federated third-party gateway, such as an existing AWS, Azure, Kong, or Envoy deployment, keeps its own software and its own hosting, and is simply brought under the same governance layer without a rip-and-replace migration.
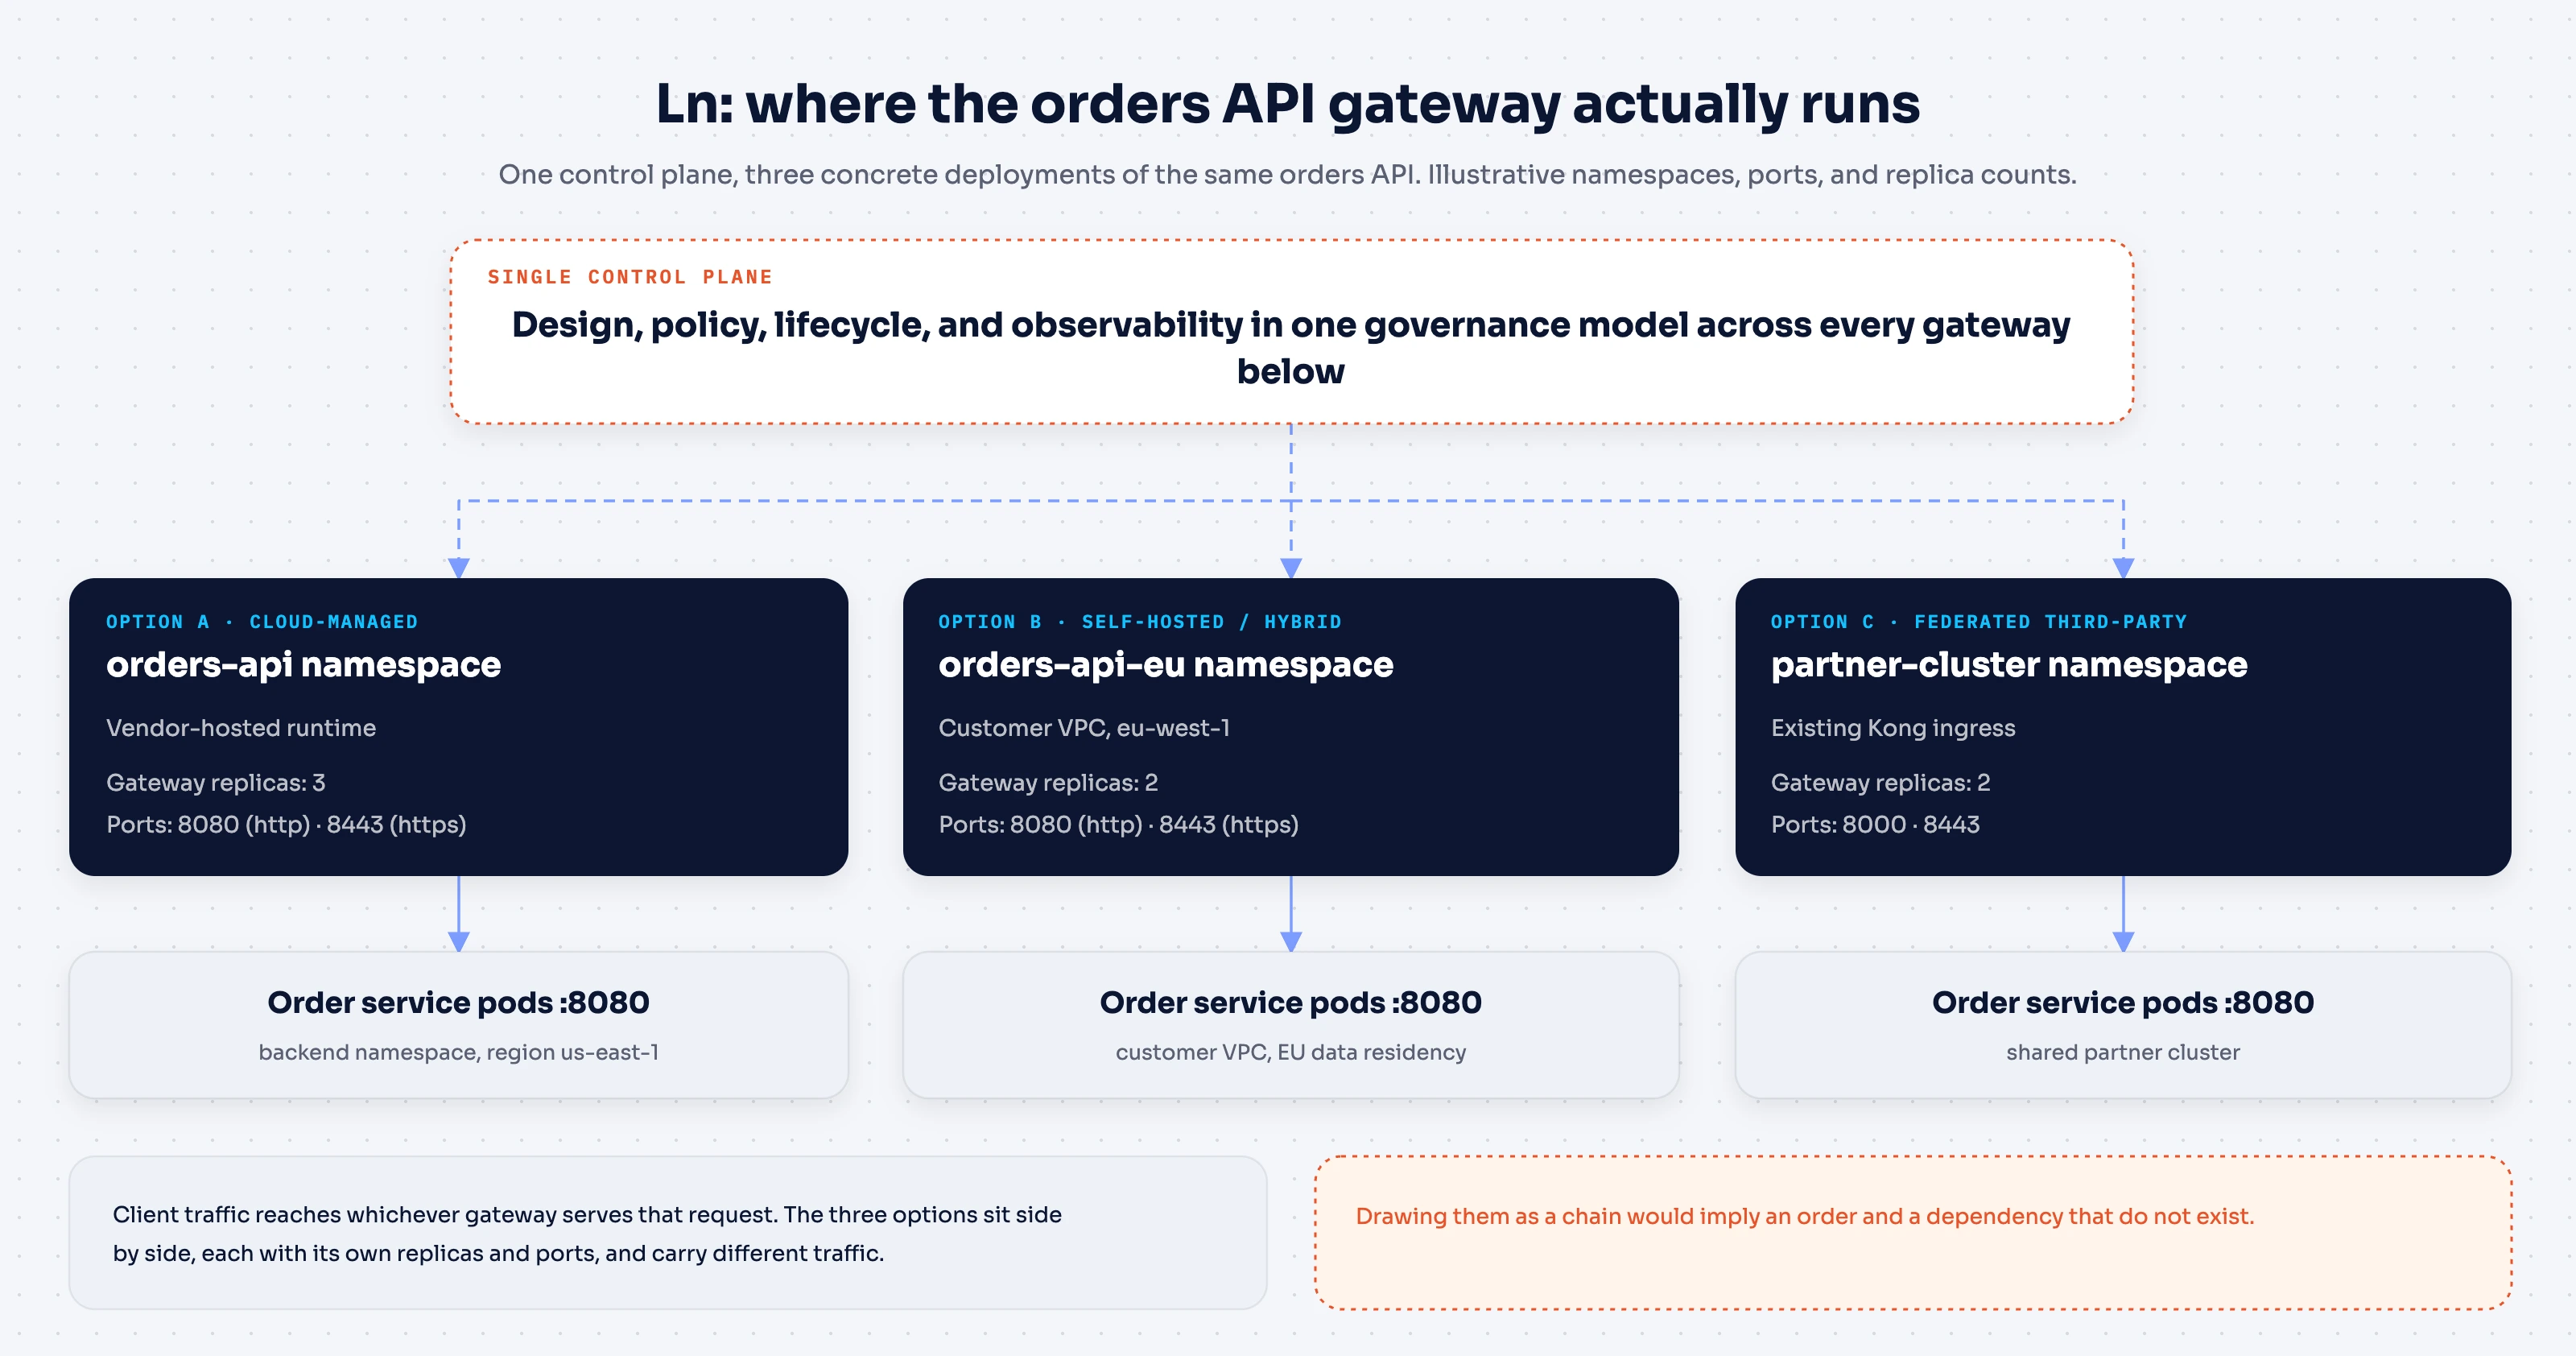
The diagram earns its keep here by making an easy assumption visible, and showing that it's wrong. These three deployment types aren't sequential stages a request passes through; they're parallel options. A real deployment might run all three at once for different traffic, with one control plane providing consistent policy across all of them, rather than three separate governance models to maintain.
What this worked example says about diagramming in general
A few lessons from this exercise generalize beyond API gateways:
- Abstraction at L0 is a discipline, not a shortcut. Leaving out product names isn't hiding information. It's deferring detail the audience doesn't need yet.
- Governance relationships aren't traffic paths. A control plane, a policy engine, or a monitoring system configures a component. In a diagram, it should look different from a component the request actually flows through.
- Independent options should look independent. Three deployment models under one control plane are not three steps. Drawing them as a chain misleads the reader into assuming an order or a dependency that isn't there.
Review the diagram before sharing it
- State the audience and the decision the diagram supports.
- Distinguish runtime calls from configuration and telemetry relationships.
- Label trust boundaries and the components that enforce access.
- Show the failure path that matters for the review, such as a rejected credential or backend timeout.
- Use consistent names across diagrams and the API documentation.
- Record an owner and review date so future changes have a clear maintainer.
For the behavior behind these boxes and arrows, see AI gateway vs API gateway. The same separation of request flow and governance is useful when converting REST APIs to MCP.
Tools for creating API architecture diagrams
Notation matters less than the audience-first discipline behind it.
- UML: Teams that already think in UML can use component and sequence diagrams for the L1–L2 level of detail.
- Text-based tools like Mermaid: These work well when diagrams need to live in version control next to the API's source code and its documentation. The diagram is just a file, so it can be reviewed and diffed like code.
- General-purpose tools such as Lucidchart: These suit L0 and business-facing views, where the priority is a clean visual for a non-technical audience rather than a notation with formal semantics.
None of these choices changes what L0-to-Ln asks for: pick the level of detail the audience needs, and use whichever tool draws that level clearly. Teams earlier in their API design maturity often start with whatever general-purpose tool they already have licenses for. They move specific diagram types to a more specialized notation only once a recurring audience, such as a security review board or an onboarding cohort, justifies the switch.
Conclusion
The L0-to-Ln methodology is a discipline for matching detail to the audience, not a diagramming notation of its own. It applies to real API architecture, from an abstract executive view down to the deployment topology of individual gateways. That keeps a diagram from either overwhelming a business stakeholder or under-serving an engineer who needs to build the thing.
A few practices carry across every level:
- Start one level more abstract than feels natural.
- Add detail only when a real decision requires it.
- Keep governance relationships visually distinct from traffic paths.
Skipping any of these tends to produce the same failure: a single overloaded diagram that nobody fully trusts, because it's trying to answer every audience's question at once.
The pattern holds regardless of which components sit behind the "API layer" box at L0. A control plane governing one or more gateways is a common enough shape that most API architecture diagrams, at some level, end up drawing a version of it. Start at the level your next conversation actually requires, and add detail only when a real decision calls for it.
Frequently asked questions
What is API architecture?
API architecture is the overall design of an API's components, such as gateways, backend services, and data stores. It covers how those components are structured and how they communicate with each other and with clients. An API architecture diagram is simply how that design gets communicated visually, at whatever level of detail the reader needs.
What are the common API architecture styles?
REST remains the most widely used style for general-purpose APIs. Common alternatives include gRPC for low-latency internal service-to-service calls, GraphQL for flexible client-driven queries, and event-driven or asynchronous messaging for workloads that don't need an immediate response. Most real systems mix more than one style rather than standardizing on a single one.
What are the core principles behind REST APIs?
REST APIs are generally built around a handful of constraints. The server keeps no client session state between requests. Resources are addressed and manipulated through one consistent interface. Responses indicate whether they can be cached and reused. And a layered system lets intermediaries, like gateways, sit between client and server without either side needing to know about them.
What are the typical stages of the API lifecycle?
Most API programs move through a similar sequence. First comes design, where the contract and data model are defined. Then build and test, followed by deployment and publishing through a gateway. Once the API is live, the focus shifts to ongoing monitoring, versioning, and governance. An architecture diagram tends to change shape at each stage, since a design-time view and a runtime deployment view answer different questions.
Do I need a different diagram for every audience?
Not a different diagram built from scratch, no. The L0-to-Ln methodology produces one progressively detailed set of views for each architecture vertical, such as business, solution, and deployment. Each audience simply stops at the level that answers their question, rather than needing an entirely separate diagram built just for them.